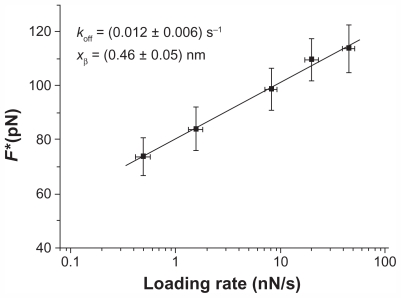
Figure 6.
Plot of the unbinding forces versus the logarithm of the loading rates for the p28/DBD complex. Statistical errors are given by standard deviation. The line is obtained by fitting the experimental data by the Bell-Evans model (Equation 2).
Abbreviations: DBD, DNA-binding domain; koff, dissociation rate constant; F*, the most probable unbinding force; xβ, width of the potential barrier along the direction of the applied force.

