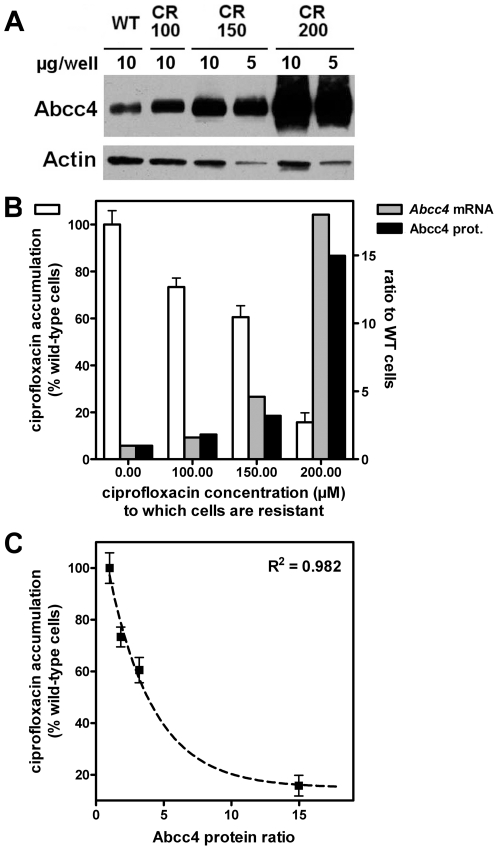
Figure 1. Relationship between cellular accumulation of ciprofloxacin and Abcc4 expression.
A. Upper panel: western blot of Abcc4 (and actin as loading control) in cell lysates from wild-type (WT) macrophages and from cells resistant to different concentrations of ciprofloxacin (100 µM [CR100], 150 µM [CR150] and 200 µM [CR200]). B. Ciprofloxacin accumulation and Abcc4 mRNA and protein relative expression in cells made resistant to increasing concentrations of ciprofloxacin; (i) left axis (open bars): accumulation of ciprofloxacin in % (mean ± SD [n = 3]) of the value measured in wild-type cells incubated during 2 h with 50 µM ciprofloxacin [absolute value: 162 ng/mg prot.]); (ii) right axis: Abcc4 mRNA (grey bars) and protein (black bars) levels as a ratio to the value observed in wild-type cells (set to 1). C. Correlation between ciprofloxacin residual accumulation and Abcc4 relative expression in these cells. The curve corresponds to a best fit based on an inverse logarithmic function (y = 11.5×e−0.3037 X+14.92).

