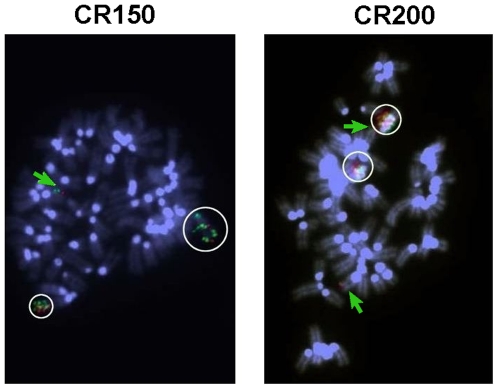
Figure 4. DnajC3 and Abcc4 FISH analysis in selected resistant cell lines.
Metaphase spreads of CR150 (left) and CR200 (clone II; right) cells were subjected to FISH analysis with an Abcc4 BAC probe (green) and a DnajC3 BAC probe (red). Chromosomes were counterstained with DAPI. Colocalization of both probes in amplified regions is highlighted with white circles; green arrow indicates Chr 14 with Abcc4 and DnajC3 copies.

