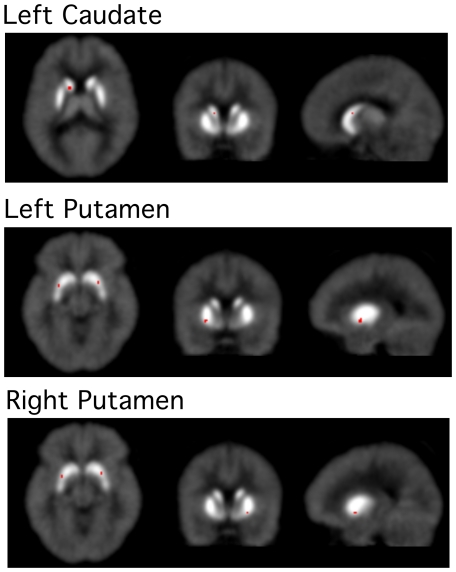
Figure 2. t-maps of ΔBP showing reduction in the ligand binding potential during task performance.
The t-maps generated using extended reference region tissue model (E-SRTM) show striatal areas where the ligand binding potential decreased significantly in the Incongruent condition in comparison with the Congruent condition. It was most significant in the left caudate and putamen. These areas are located in close proximity to the locations where increased rate of ligand displacement was observed (Figure 1). An agreement in the data computed using two different receptor kinetic models significantly enhances the reliability of results.

