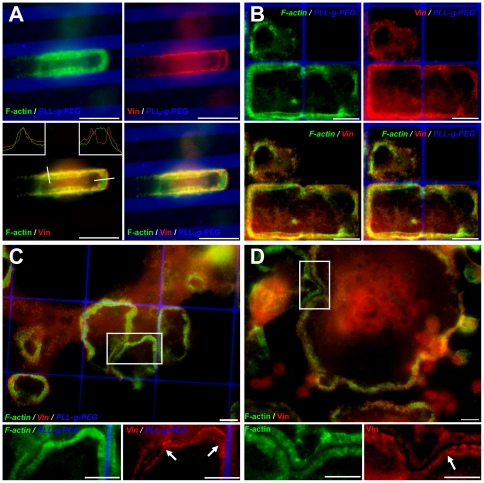
Figure 4. Loss of one vinculin band upon blocking sealing zone expansion.
(a, b) SZ arrested at a VN/PLL-g-PEG interface on striped and square micro-patterns: a) 5.35 µm-wide VN stripes, separated by 3.3 µm-wide barriers. Inserts: display of line scans of actin and vinculin fluorescence across the SZ at the VN/PLL-g-PEG border (left insert) and when on a uniform VN-coated surface (right insert). b) 20×20 µm VN squares, separated by 1 µm-wide barriers; (c, d) SZ arrest by an intercepting SZ within the same cell or a neighbouring cell, respectively. c) a SZ on square micro-patterns of 40×40 µm, barrier 1 µm-wide; d) a peripheral SZ on non-patterned, VN-coated glass slides. Inserts (bottom) show higher magnification of selected areas, with arrowheads indicating the loss of the vinculin ring in arrested SZ areas, green: phalloidin-FITC; red: anti-vinculin 546 nm; blue: PLL-g-PEG-Atto-633. Scale bars, 10 µm.

