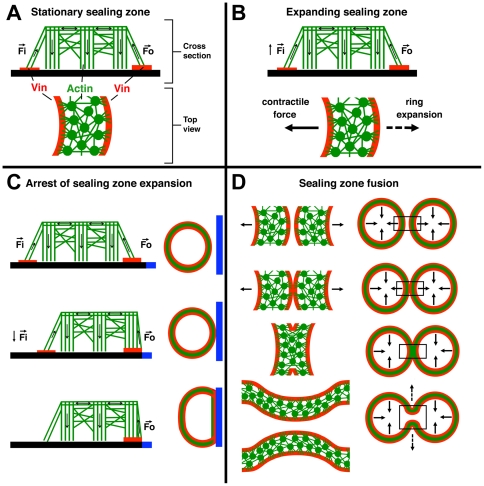
Figure 7. Schematic drawing depicting a possible model for force associated regulation of SZ formation, expansion and fusion.
Podosomes are displayed in cross-section, with vertical stripes representing the branched actin core bundle, and horizontal lines indicating the interconnecting actin fibers; top view shows podosome circular actin cores and centrifugally expanding actin fibers either anchoring the cores to the membrane, or interconnecting them. Adhesive plaque areas are represented in red, while black bars represent the adhesive surface. Arrows display forces (Fi = force acting on the inner plaque band and Fo = force acting on the outer plaque band). (a) Cross-section and top view of a SZ. (b) A possible two-force regime balancing SZ expansion and integrity, responsible for the force-dependent formation of the inner and outer adhesive plaque domains. (c) Model indicating the force-dependent loss of the inner plaque band upon arrest of SZ expansion. The blue bar represents the PLL-g-PEG barrier. (d) Force- dependent model of SZ fusion, where fusion of the two outer plaque bands is followed by the interlinking of the podosome cores of the two rings, leading to local cancellation of the net force. This, in turn, finally leads to the local disassembly of the podosomes, and the fusion of the two rings.

