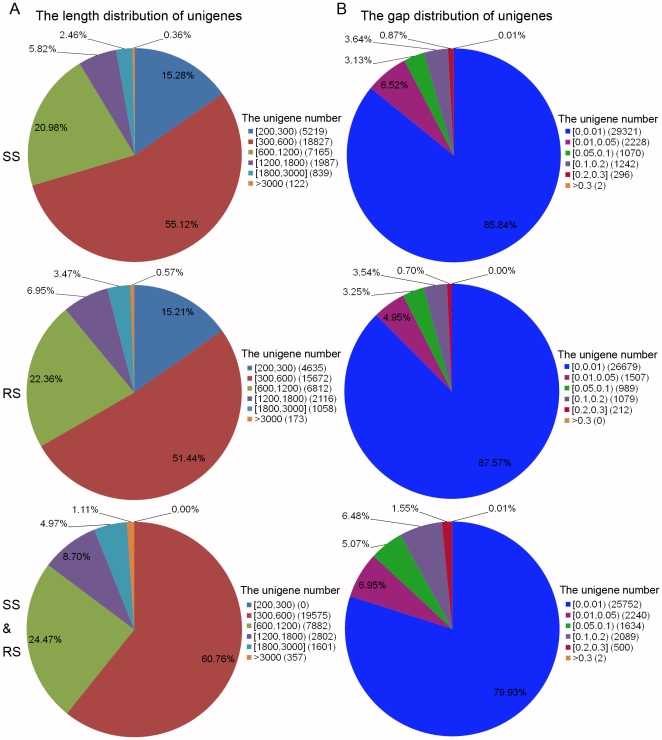
Figure 1. The length and gap distribution of unigenes after de novo assembly using the reads from SS, RS and SS&RS samples.
A: Length distribution of unigenes. Numbers in square brackets (e.g., [200,300) and [1800,3000]) indicate the range of unigene length, while ‘>3000’ indicates unigenes longer than 3,000 bp. Numbers in parentheses (e.g., (5219) and (18827)) indicate the total number of unigenes falling in this length range. B: Gap distribution of unigenes. Values in square brackets indicate the ratio of the N number and all nucleotide base pair number for one unigene. Numbers in parentheses (e.g., (29321) and (2228)) indicate the number of unigenes that lie in the gap ratio (e.g., [0, 0.01) and [0.01, 0.05)).

