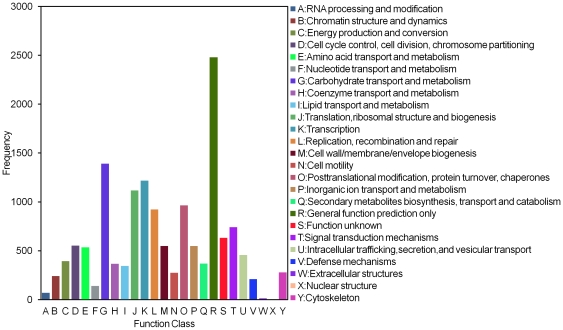
Figure 3. Histogram representation of clusters of orthologous groups (COG) classification.
7,075unigenes were assigned to 25 categories in the COG classification. The y-axis ‘Frequency’ indicates the number of genes in a specific function cluster. The right legend shows a description of the 25 function categories.

