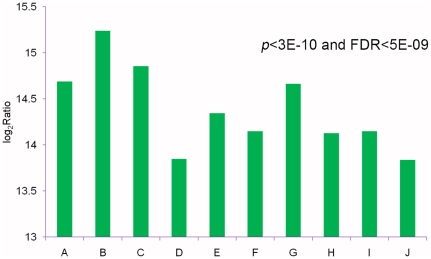
Figure 5. Analysis of expression levels of the top ten up-regulated transcripts between the two samples (RS vs. SS).
The y-axis indicate the fold-changes of up-regulated genes. Categories in the x-axis represent genes homologous to (A) ‘heme/copper-type cytochrome/quinol oxidases, subunit 1’, (B) ‘F0F1-type ATP synthase, subunit a’, (C) ‘heme/copper-type cytochrome/quinol oxidases, subunit 2’, (D) ‘cytochrome b subunit of the bc complex’, (F) ‘heme/copper-type cytochrome/quinol oxidase, subunit 3’ and (J) ‘NADH: ubiquinone oxidoreductase subunit 1 (chain H)’,respectively. The remaining genes (E, G, H, I) had no functional annotation.

