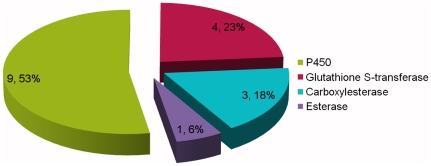
Figure 6. Pie chart representation of several genes, mainly implicated in insecticide metabolism.
The number preceding the each percentage indicates the number of unigenes encoding a specific metabolism enzyme with log2Ratio greater than 2. The percentages indicate the propotion of each specific unigenes in four kinds of known enzyme unigenes.

