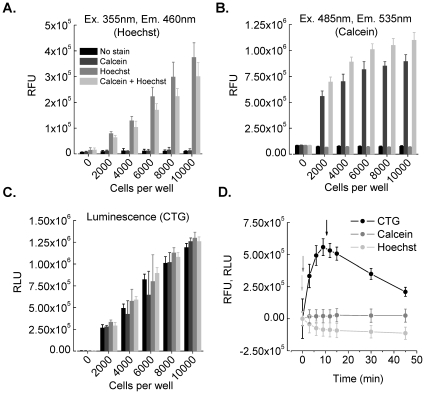
Figure 2. Development of the cell fitness multiplexing assay.
A–C. Correlation analysis of cell number, fluorescence and luminescence intensities recorded from differently stained HEK293 cells. Cells were seeded at densities between 0–10000 cells per well, cultured overnight and stained with Calcein-AM (dark grey), Hoechst 33342 (grey) and a mixture of Calcein-AM and Hoechst (light grey). For determination of background signal a population of cells remained unstained (black) in the experiments where fluorescence indicators are used. The histograms show averaged fluorescence and luminescence intensities (n = 12 wells, error bars: ±SD). Background signal measured in empty wells is weak compared to the signal measured from stained cells or from unstained cells. Fluorescence intensities of single-stained cells (Hoechst or Calcein) differ significantly from multiplexed cells, probably due to fluorescence quenching of Hoechst by energy transfer to Calcein (Fig. 2B, grey, light grey) and additive excitation of Hoechst by Calcein excitation (Fig. 2C, dark grey, light grey). Luminescence signals are not affected by fluorescence emission. Signal intensities measured in Hoechst (double-stained cells) and CTG fitness indicators (double-stained and CTG treated cells) correlate well to the number of seeded cells whereas fluorescence intensities recorded from double stained cells in the Calcein channel show a non-linear relationship and less correlation. D. Time course experiment for determination of optimal timing conditions. Fluorescence intensities (Calcein, grey; Hoechst, light grey) were measured immediately after media exchange (light grey and grey arrows in E., see steps 4–5 in A.) and show either no (Calcein) or only weak (Hoechst) variation over time. Luminescence signals (black) reach a maximum ten minutes after addition of CTG (see step 7 in Fig. 1A) followed by linear decrease. The black arrow indicates the optimal time point for luminescence measurement. To avoid strong variance of measured luminescence signals this time point is crucial and needs strict obedience. Data were averaged from 12 wells per condition, error bars: ±SD.

