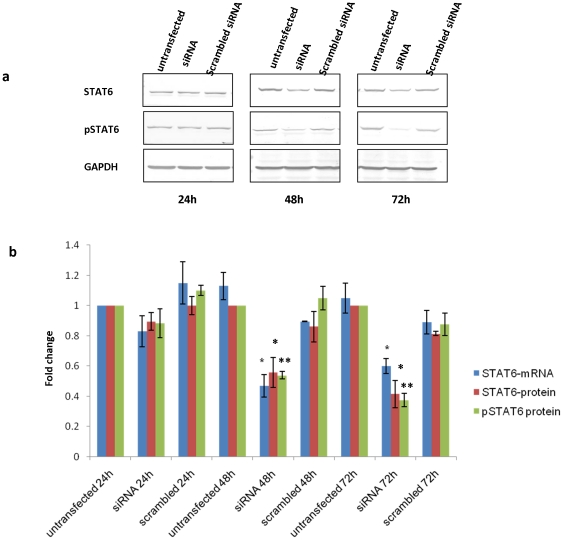
Figure 1. Silencing of STAT6 in NCI-H460 cells using STAT6 specific siRNA.
a) The western blot of STAT6 and phosphorylated form of STAT6 (pSTAT6) protein on cell extracts from untransfected, STAT6 specific siRNA and scrambled siRNA transfected NCI-H460 cells at different time points as indicated. b) Graph represents the fold change in STAT6 mRNA level, STAT6 protein and pSTAT6 protein level compared to untransfected NCI-H460 cells at respective time points. Scrambled siRNA at different time points was used as a negative control. GAPDH was used as a loading control for densitometric analysis for western blot analysis. The mRNA levels were normalized to 18s rRNA expression in Real time PCR analysis. The data is expressed as the mean ± S.D. of 3 independent experiments. * indicates p value < 0.05 in comparison to untransfected cells. ** indicates p value < 0.01 in comparison to untransfected cells. c).

