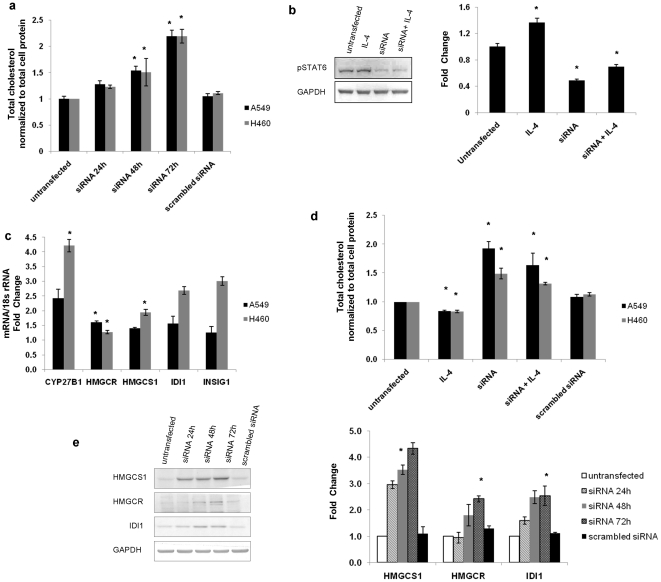
Figure 3. Role of STAT6 in cholesterol biosynthesis.
The total cholesterol levels after STAT6 knockdown was checked at different time points in NCI-H460 and A549 cells. Scrambled siRNA was used as negative control. The data is expressed as the mean ± S.D. of 3 independent experiments performed in triplicates. * indicates p value < 0.05 in comparison to untransfected cells. a) Western blot analysis was done to analyze the change in expression of pSTAT6 protein upon IL-4 treatment in NCI-H460 cells. GAPDH was used as a loading control for densitometric analysis. Graph represents the fold change in protein expression compared to untransfected NCI-H460 cells. The data is expressed as the mean ± S.D. of 3 independent experiments. * indicates p value < 0.05 in comparison to untransfected cells. b) Real Time PCR was performed to determine the changes in expression level of genes related to cholesterol biosynthesis and homeostasis in NCI-H460 cells and A549 cells 48h post transfection of STAT6 specific siRNA. The samples were normalized to 18s rRNA expression. The real time data is expressed as the mean ± S.D. of 3 independent experiments performed in triplicates. * indicates p value < 0.05 in comparison to untransfected cells. c) Cholesterol assay was carried out to determine the effect of IL-4 treatment on total cholesterol levels in untransfected and siRNA transfected NCI-H460 cells and A549 cells. The data is expressed as the mean ± S.D. of 3 independent experiments performed in triplicates. * indicates p value < 0.05 in comparison to untransfected cells. d) The western blot of HMGCS1, HMGCR and IDI1 was done on cell extracts from untransfected and siRNA transfected NCI-H460 cells at different time points. GAPDH was used as a loading control for densitometric analysis. Graph represents the fold change in protein expression compared to untransfected NCI-H460 cells. The data is expressed as the mean ± S.D. of 3 independent experiments. * indicates p value < 0.05 in comparison to untransfected cells.

