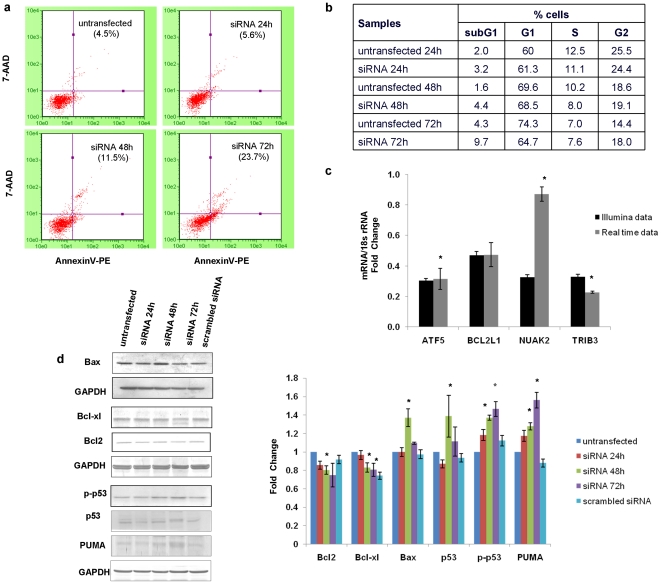
Figure 5. Effect of STAT6 silencing on apoptosis and cell cycle.
a) To determine whether STAT6 downregulation in NCI-H460 cells leads to apoptosis, Annexin-V-PE binding assay was done at different time periods as described in “Materials and Methods” section. X-axis represents Annexin V-PE positive cells whereas Y-axis represents 7-AAD positive cells. % here indicates the percentage of dead cells. b) Cell cycle assay was also done to check the distribution pattern of untransfected and siRNA transfected NCI-H460 cells in different phases of cell cycle. Cells were harvested post transfection (at different time points as indicated) and subsequently assayed for their DNA content by flow cytometry. c) Real Time PCR was done in NCI-H460 cells to validate the genes which emerged out to be associated with apoptosis or cell death from the most significant network in the IPA analysis. The samples were normalized to 18s rRNA expression. The real time data is expressed as the mean ± S.D. of 3 independent experiments performed in triplicates. * indicates p value < 0.05 in comparison to untransfected cells. d) Western blot was performed to analyze the expression of some pro-apoptotic and anti-apoptotic proteins in untransfected and siRNA transfected NCI-H460 cells. GAPDH was used as a loading control. The data is expressed as the mean ± S.D. of 3 independent experiments. * indicates p value < 0.05 in comparison to untransfected cells.

