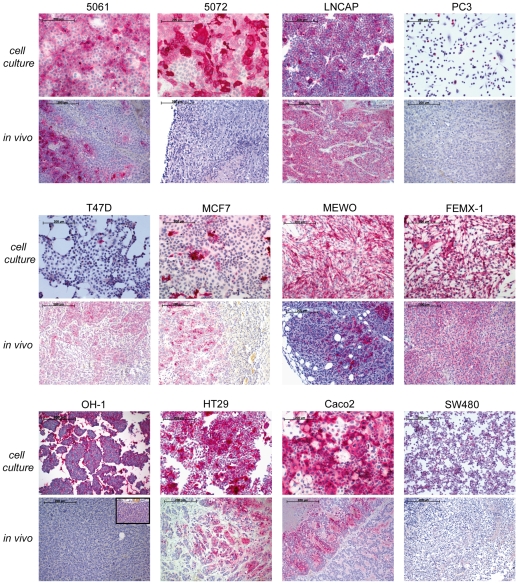
Figure 4. CEACAM protein expression pattern in vivo and in vitro.
Cell lines LNCAP and FemX-1 showed in vitro and in vivo strong binding of mAb T84.1 by all cells. In contrast, cell lines 5061, MEWO, OH-1 (insert with higher magnification) HT29, Caco2, and particularly 5072 showed strong mAb T84.1 in vitro binding, but little or no binding in vivo. (red = T84.1 binding).

