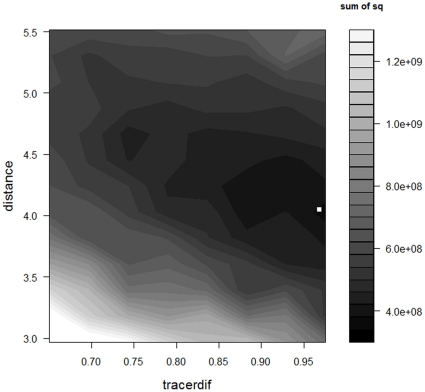
Figure 3. Visualisation of the sensitivity analysis (±30%) for the activity parameter and the parameter accounting for density differences between luminophores and non-marked particles, ‘density’.
Low values of the objective function (dark grey shades) indicate a good fit between model predictions and the observed data. The white square indicates the location of the optimised parameter combination. Sum of sq = sums of squares.

