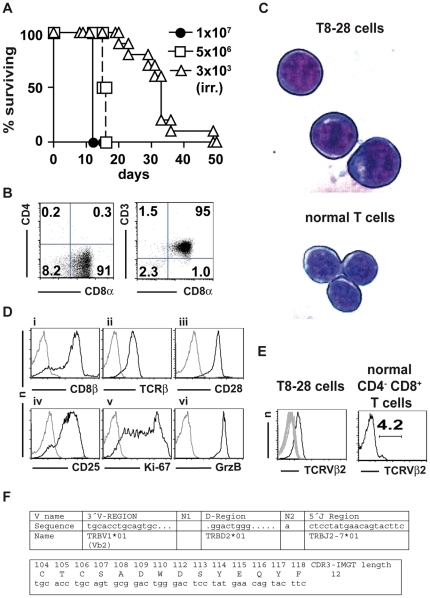
Figure 1. In vivo tumorigenicity of and T cell marker expression by T8-28 cells.
(A) Survival of unmanipulated BALB/c.OlaHsd mice transplanted with 1×10⁷ (experiment 1; n = 2) or 5×10⁶ (experiment 2; n = 2) T8-28 cells or irradiated BALB/c.OlaHsd mice transplanted with 3×10³ T8-28 cells on day 0 (pooled data of two experiments; n = 10). (B) CD4, CD8α and CD3 expression by T8-28 cells. Figures indicate the percentages of cells in the respective quadrants. (C) Cytospins of T8-28 and freshly isolated mouse T cells stained by the Diff-Quik® method. Original magnification was 630-fold. Microscope: LEICA DMIRE2. Camera: LEICA DFC300 FX. Acquisition Software: LEICA IM50 Image Manager. Adobe Photoshop CS3 was used to obtain the close-ups shown. (D) Fluorescence-activated cell sorting analysis of T cell lineage and activation markers as indicated (black histograms). Staining controls (grey histograms): i, v, isotype-matched control mAb; ii,vi, non-isotype-matched control mAb; iii, no primary mAb; iv: identical control staining as in iii. (E) Expression of TCRVβ chains by T8-28 cells and CD4− CD8+ T cells of a normal BALB/c mouse as indicated. Grey histograms represent overlays of the 14 remaining TCRVβ chains (Vβ3–Vβ18) detected by the kit used. (F) The genetic setup and primary structure of the TCR CDR3 region was analyzed by polymerase chain reaction DNA sequencing and the IMGT/V-QUEST program. Please note that TRBV1 in the IMGT nomenclature is identical to designation as Vβ2 used throughout this paper and that the *01 allele has originally been found in BALB/c mice which is consistent with the origin of the T8-28 cells. The sequenced Cβ part (not shown) could be identified as Cβ2 as expected for a TCR-chain using the second DJ cluster.

