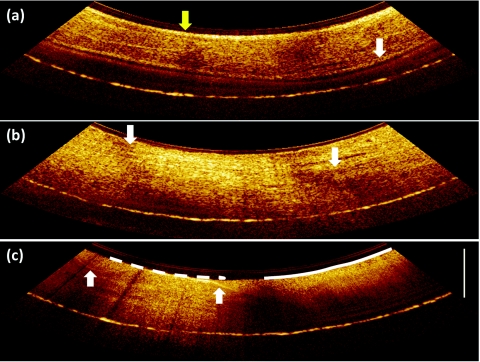
Figure 3.
(a) OCT image of atrial endocardial wall, visualized transmurally; endocardium (yellow, upper one) and epicardium (white) (relatively bright lines) are marked by arrows, respectively (Video 1); (b) OCT image of ventricular endocardial wall with polarization-dependent bands marked as arrows; (c) OCT image demonstrating incomplete catheter-tissue contact. The segment in contact marked by the dashed line shows a deeper, layered image of myocardium, while the segment not in contact marked by the solid line shows a shallower, homogeneous image of blood. The tissue and blood boundary are marked by the arrows. Scale bar: 1 mm.

