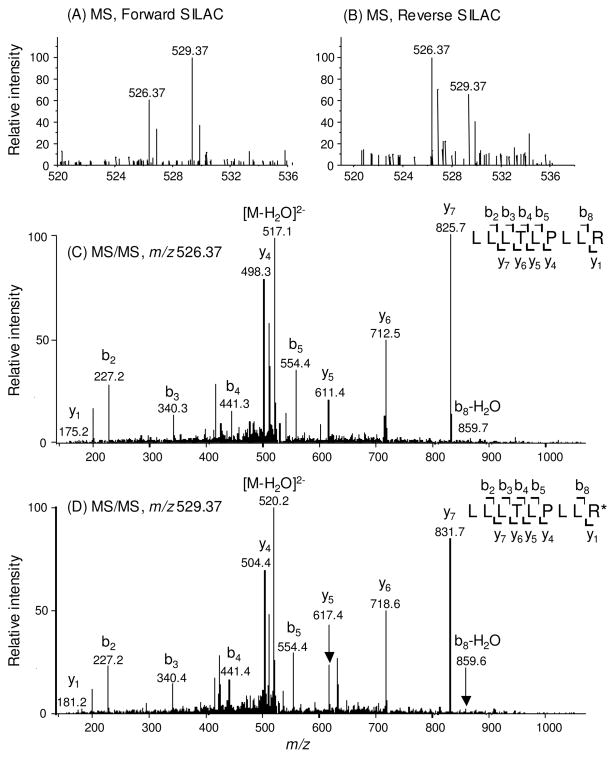
Figure 2.
Representative ESI-MS and MS/MS data revealing the lovastatin-induced down-regulation of ERα. Shown are the MS for the [M+2H]2+ ions of ERα peptide LLLTLPLLR and LLLTLPLLR* (‘R*’ designates the heavy arginine) from the forward (A) and reverse (B) SILAC experiments. Depicted in (C) and (D) are the MS/MS for the [M+2H]2+ ions of LLLTLPLLR and LLLTLPLLR*, respectively.

