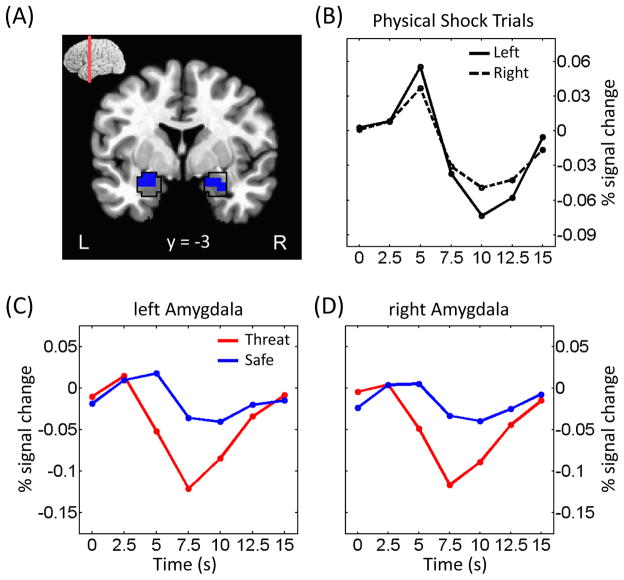
Figure 6.
Cue-related responses in the amygdala. (A) Voxels within the anatomically defined amygdala (as defined via the AFNI anatomical template; black outline) exhibiting stronger responses during safe vs. threat. (B) Mean estimated responses from the left and right amygdala during trials in which electrical stimulation was administered. (C, D) Mean estimated responses from the left (C) and right (D) amygdala during safe and threat conditions (as in all other analyses reported in the paper [except those of panel B], trials containing shock were discarded).

