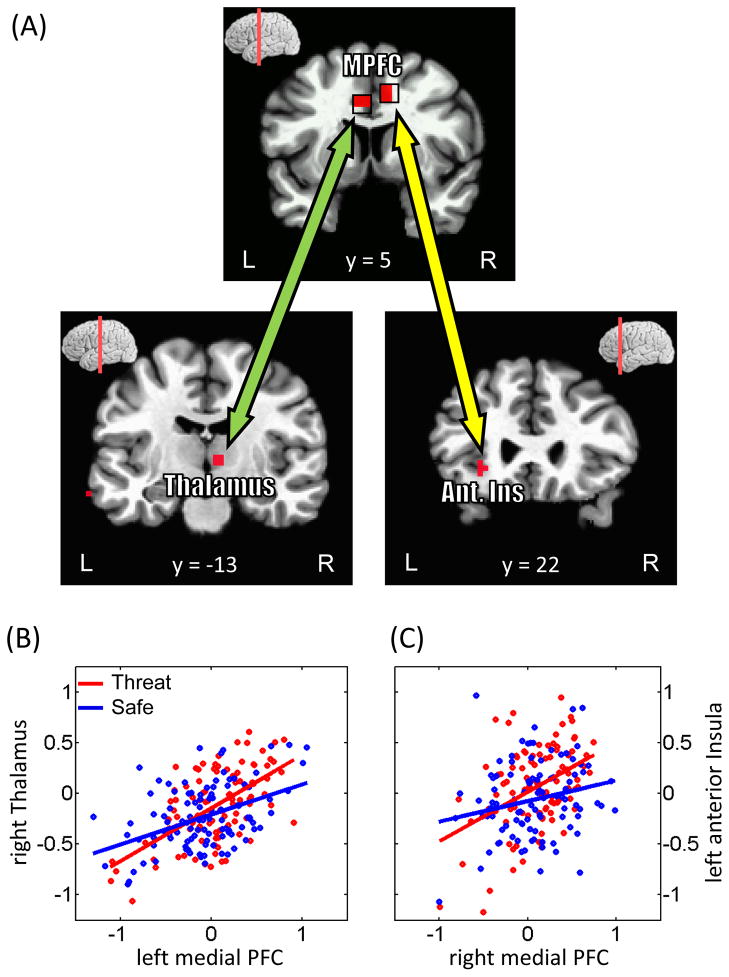
Figure 9.
Functional connectivity on a trial-by-trial basis. (A) Regions exhibiting stronger functional connectivity with the medial PFC during the cue phase. The top panel illustrates the ROIs employed as “seed” regions. MPFC, medial prefrontal cortex; Ant. Ins, anterior insula. (B, C) The scatter plots show trial-by-trial responses in the left medial PFC and right thalamus (B) and in the right medial PFC and left anterior insula (C). Responses to threat trials are shown in red and to safe trials are shown in blue. Robust linear fits to the data are presented in the corresponding colors. Data are illustrated for representative individuals.

