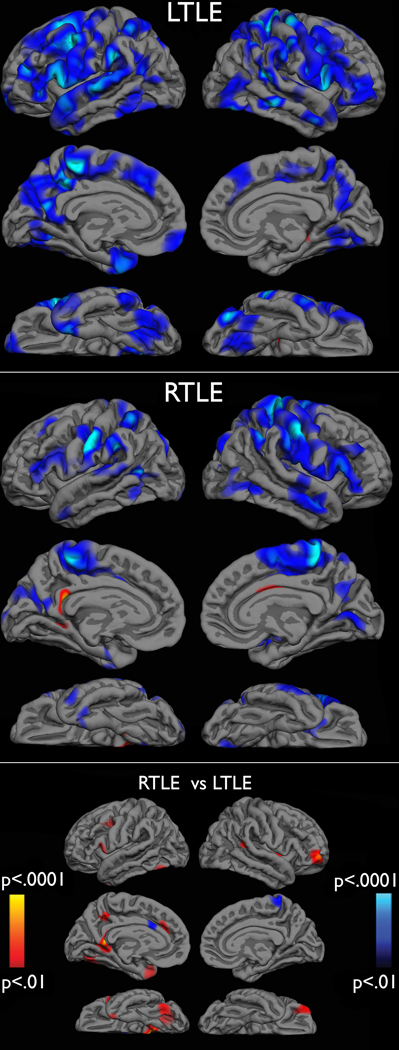
Figure 3.
Cluster-based t-statistic surface maps of cortical thinning in patients with LTLE versus controls (top), RTLE versus controls (middle), and RTLEs versus LTLEs (bottom). Cluster maps are thresholded at t > 2, corrected p-values < .05. In the top and middle graphs, blue areas represent areas of thinner cortex in patients compared to controls and red areas represent areas of thinner cortex in controls compared to patients. In the bottom graph red areas represent thinner cortex in patients with LTLE compared to patients with RTLE. Areas of blue represent thinner cortex in patients with RTLE.

