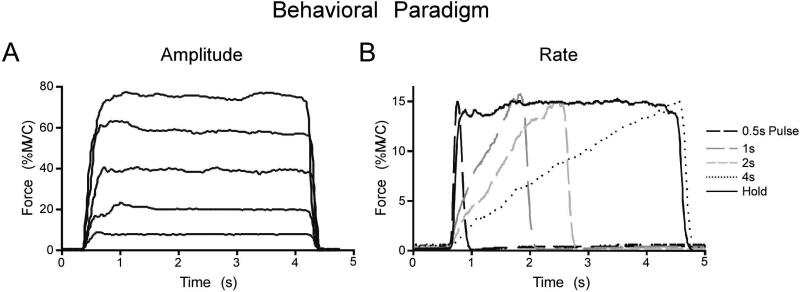
Figure 1.
A. Recorded force trace from the force amplitude experiment showing one subject performing a single isometric contraction to the 5%, 20%, 40%, 60%, 80% MVC force levels. All contractions in the force amplitude experiment were approximately 4s long. B. A recorded force trace from the rate experiment showing one subject performing a single isometric contraction during the 0.5s Pulse, 1s, 2s, 4s, and Hold conditions. All contractions in the rate experiment had a peak force amplitude of 15% MVC.

