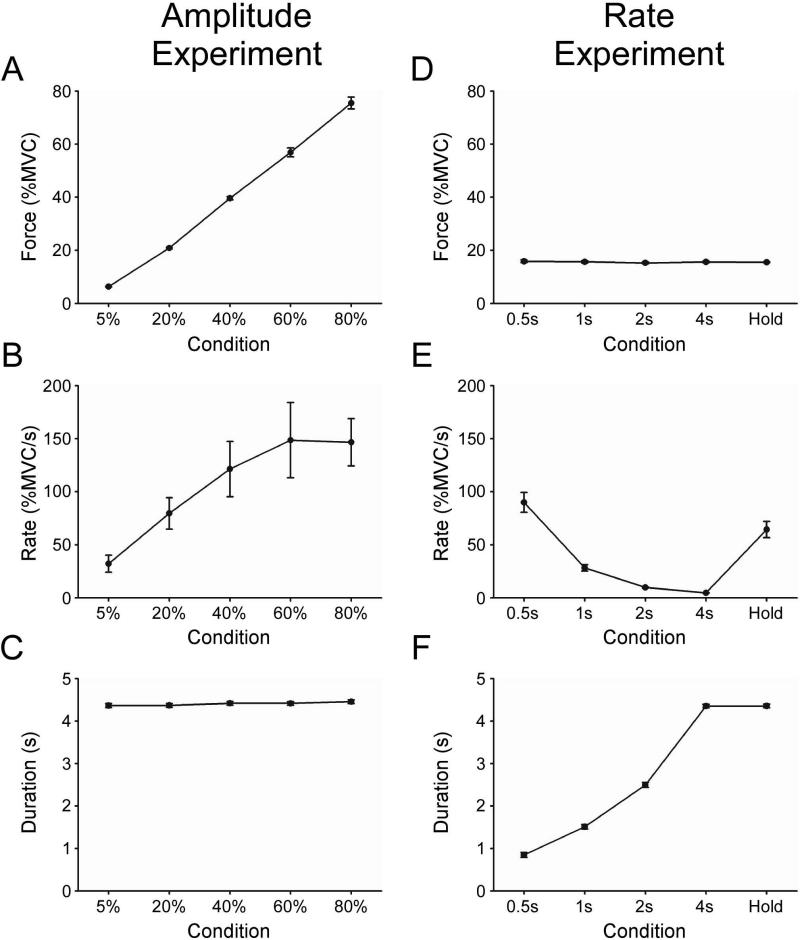
Figure 2.
A-C and D-F depict behavioral data for the force amplitude experiment and the rate experiment, respectively. A plot of group mean force amplitude (A) depicts that subjects were able to produce force close to the target level for each of the five conditions. Rate of change of force increased with force amplitude (B), while a plot of duration of force shows that the contractions were of similar length during all five conditions (C). In the rate experiment, the group mean force was similar across all conditions (D). Subjects effectively produced contractions with decreasing rate of change of force across the 0.5s, 1s, 2s, and 4s conditions (E). Contractions increased in duration across the 0.5s, 1s, 2s, and 4s task conditions (F). Error is the standard error of the mean. In some instances, the error is not apparent because the error across subjects was very small and the y-axis scale is large.

