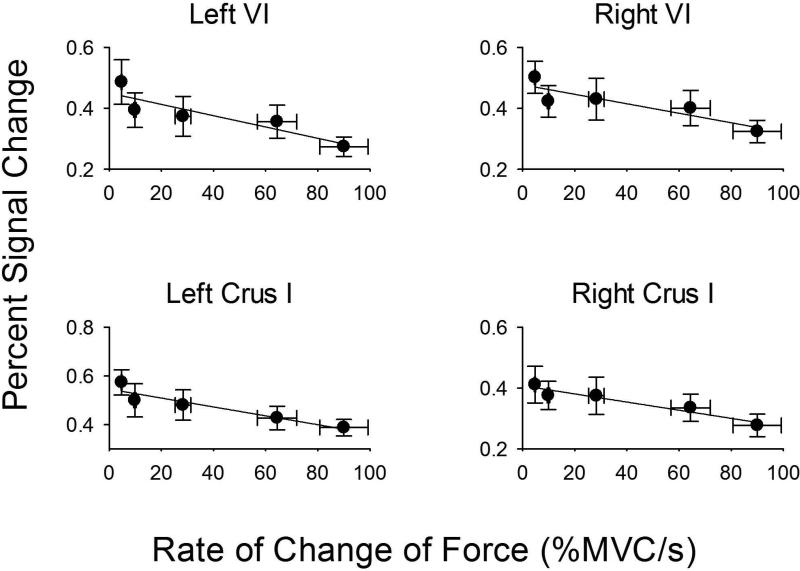
Figure 6.
Rate of force plotted against percent signal change in ROIs that include: left lobule VI, right lobule VI, left Crus I, and right Crus I. Rate of force is on the x-axis because this was the independent variable manipulated in the study. Each plot represents the average rate/percent signal change across subjects, along with the standard error of the mean for the x and y axes. The error for rate (x axis) was small at the low rate levels, and can only be visible at the high rate levels. In each plot, the negative slope from the regression analysis was significant at p<.05.

