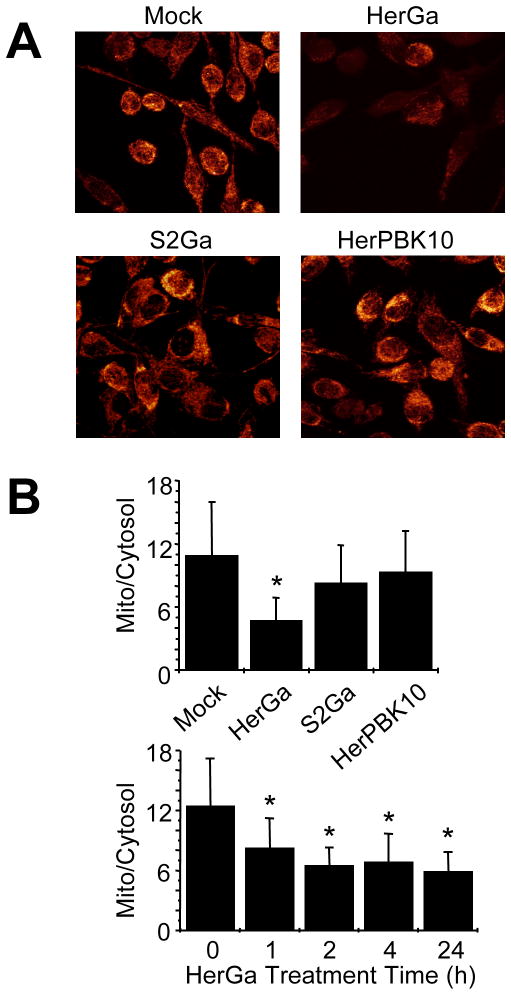
Fig. 2. HerGa impacts mitochondrial membrane permeability.
MDA-MB-435 cells exposed to HerGa or S2Ga (at 1 uM corrole concentration), HerPBK10, or PBS received 20nM TMRM in PBS at 24h after treatment, followed by two-photon excited confocal fluorescence imaging after TMRM uptake. A, Cells displaying respective fluorescences as the z-stacked maximum intensity projection of each acquired fluorescence image. B (upper), Mitochondria/cytoplasm ratio of TMRM fluorescence averaged from three independent experiments represented by A (TMRM uptake). For each experiment, the average fluorescence intensity for 10 different mitochondria regions and one mitochondria-free region (cytoplasm) within the same cells were measured respectively. B (lower), Timecourse of membrane collapse. TMRM uptake during HerGa treatment was assessed as described in the Methods with mitochondrial/cytoplasm TMRM fluorescence ratios obtained at the indicated timepoints after HerGa treatment. *, P<0.05 compared to (B, upper) mock (PBS) treatment, or (B, lower) time point 0, as determined by 2-tailed unpaired t-test.

