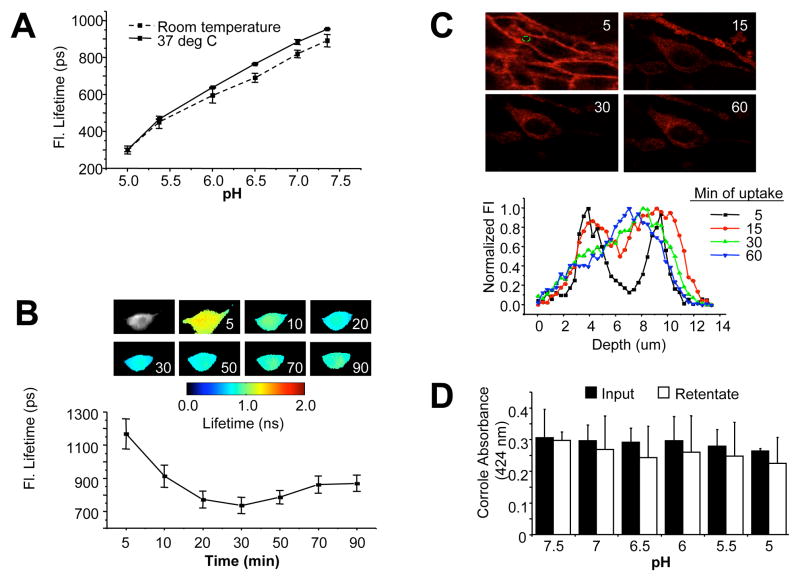
Fig. 4. Effect of pH on corrole retention and fluorescence lifetime.
A, Measurement of HerGa fluorescence lifetime in titrating pH buffers. Fluorescence lifetime of 25uM HerGa solutions in different pH (5.0, 5.5, 6.0, 6.5, 7.0, and 7.5) was measured at room temperature and 37°C respectively, in a cell-free system. During the measurements, the temperature was strictly (~0.1°C) controlled by a ΔT culture dish system. Before adding the corroles to the chamber, the pH of each corrole solution was confirmed with a pH meter. B, Monitoring fluorescence lifetime changes of HerGa during uptake into MDA-MB-435 cells. Fluorescence lifetime images of HerGa were acquired at different time points (5, 10, 20, 30, 50, 70, and 90min) after addition of 25 uM HerGa into the delta T chamber containing attached MDA-MB-435 cells. A total of 25 images were acquired (0–4800ps; Time step: 200ps; gate width: 600ps, Ex: 424nm, light pulse width: 100fs). The images were analyzed (lower graph) using the first order exponential decay fitting method. C, Monitoring HerGa fluorescence as a reflection of uptake kinetics. Two-photon fluorescence imaging-enabled acquisition and analysis of HerGa (25 uM) at various depths during uptake in MDA-MB-435 cells. Images were acquired at different time points of HerGa uptake (5, 15, 30, and 60 minutes after addition to cells) and at different z-depths with a step size of 350nm (Ex: 780nm; Em: 600–650nm). Micrographs show images at 6um depth at indicated time points during HerGa uptake. The graph shows the fluorescence intensity z-depth profile of the region selected by a dotted circle in the first micrograph. D, Evaluating corrole retention under decreasing pH conditions. The acidity of a HEPES-buffered saline solution was adjusted to the indicated pH levels and pre-assembled HerGa was added to each pH buffer and incubated for 30 min at room temp (in a cell-free system), followed by filtration through 10K mwco membranes to remove any released corrole. The absorbances at 424 nm (maximum absorbance wavelength of gallium corrole) were obtained from the preassembled complex before incubation with each pH buffer (“Input”) and the filtered complex recovered from the ultrafiltration device after incubation with each pH buffer (“Retentate”). Error bars represent SD of repeat experiments. N=2–3 samples/pH per experiment.

