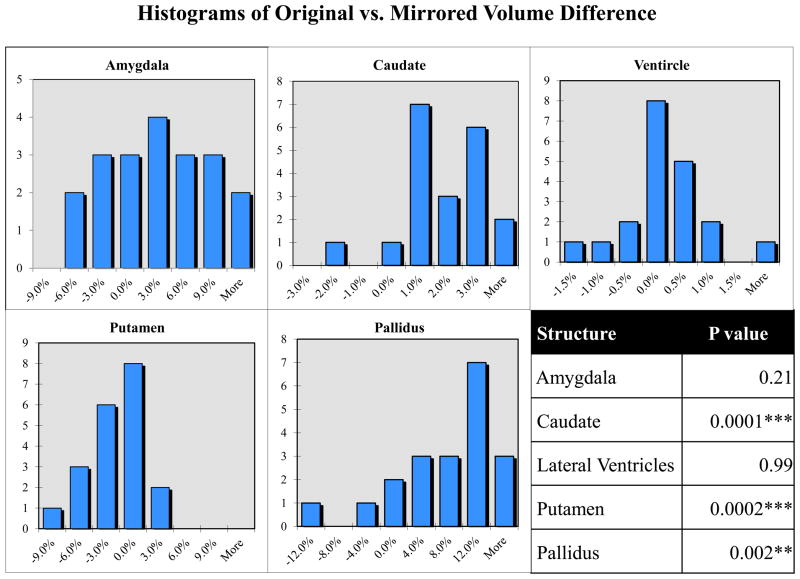
Figure 3.
Distribution of original vs. mirrored volume difference for right and left structures. The volume of each structure segmented on an original image is compared (via eq. 2) to the volume of the same structure segmented on the corresponding mirrored image. In the absence of bias, the histograms should consist of a normal distribution with a mean of zero. Significance values (student t-test) indicate a systematic hemispheric asymmetry bias.

