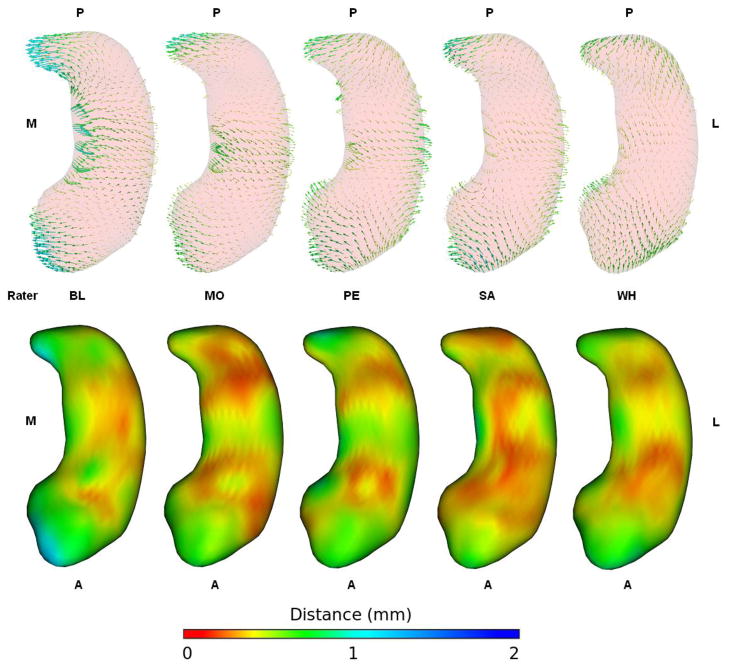
Figure 6.
Difference vectors and standard deviation maps for each rater. Right and left hippocampi are combined and vectors are averaged across all subjects. The vectors are lengthened by a factor of 2. These vectors share the same color map and scale as those in figures 3 and 5. The bias appears to be very consistent between raters, with all raters except WH shifting the head and tail medially and the body laterally such that the structures appear more curved when segmented on the right side of the image.

