
Fig. 4.
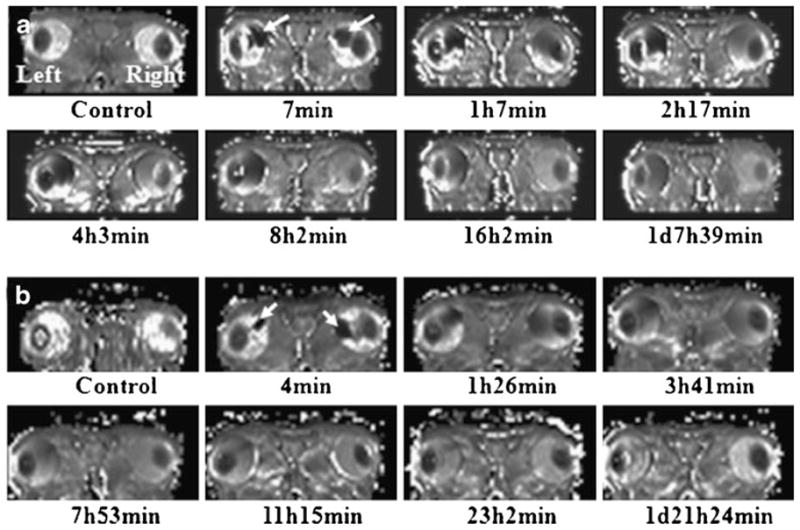
Representative time varied T1 map computed using MR images acquired with ms-DSEPI- T12 for (a) PGH20 (L) and MultiHance (R) and (b) GDCP21 (L) and MultiHance (R), respectively. White arrows show the injection sites of the contrast agents.
Official websites use .gov
A
.gov website belongs to an official
government organization in the United States.
Secure .gov websites use HTTPS
A lock (
) or https:// means you've safely
connected to the .gov website. Share sensitive
information only on official, secure websites.
Representative time varied T1 map computed using MR images acquired with ms-DSEPI- T12 for (a) PGH20 (L) and MultiHance (R) and (b) GDCP21 (L) and MultiHance (R), respectively. White arrows show the injection sites of the contrast agents.