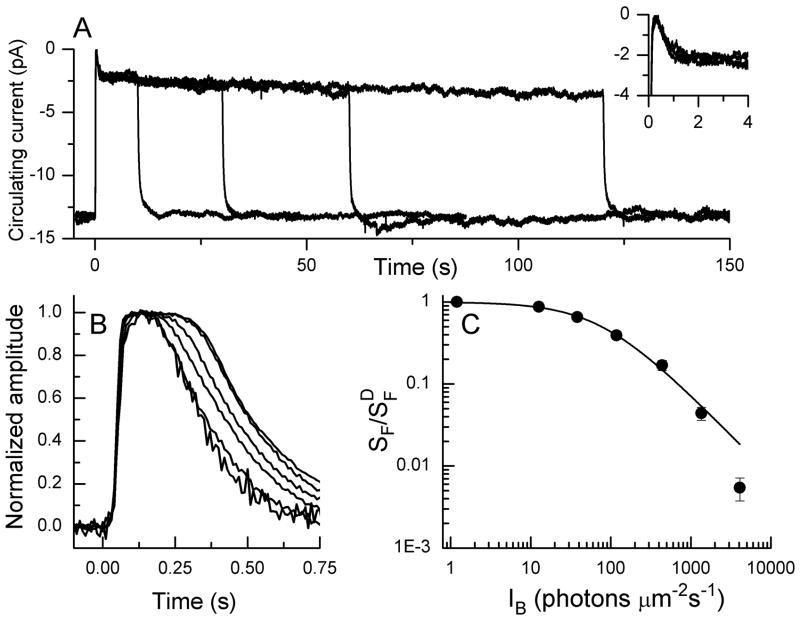
Fig. 2.
Adaptation of WT mouse rods. a Data traces are suction-electrode recordings of superimposed means of currents of 7 WT rods each exposed 3 times to steps of light 10, 30, 60, and 120 s in duration, of intensity 440 photons μm−2 s−1 and beginning at t = 0. Insert, same data at faster time resolution showing only first 4 seconds. b Flash responses recorded with suction electrodes in background light. Shown are means from 5 presentations each of 10 WT rods to 20 ms flashes beginning at t = 0; intensity was kept at 453 photons μm−2 for flashes in backgrounds of the following intensities (in photons μm−2 s−1): 0, 12, 38, 118, 438, and 1354. Responses have been normalized cell by cell to the peak amplitude of the response and averaged. The most slowly decaying response is with no background; decay time course progressively accelerated as background intensity was increased. c Weber-Fechner plot. Sensitivity (SF) in pA photons μm−2 was calculated in darkness and in the presence of background light as the peak amplitude of the response in the linear range divided by the flash intensity. Graph gives mean sensitivity divided by sensitivity in the absence of a background ( ) as a function of background intensity (IB), averaged from 10 WT rods. Solid line is best-fitting Weber-Fechner function for WT rods given by Eqn. (1) with I0 = 77 photons μm−2 s−1.

