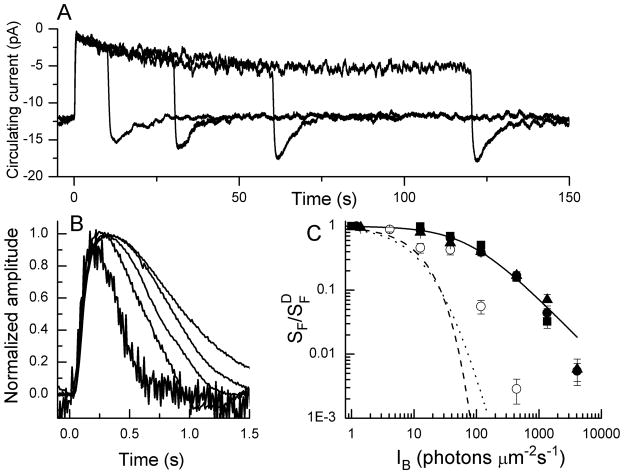
Fig. 3.
Adaptation of GCAPs−/− mouse rods [data replotted from 14]. Both genes for GCAP proteins were deleted from genome. a Data traces are suction-electrode recordings of superimposed means of currents from 3 presentations each of 5 GCAPs−/− rods to steps of light of intensity 38 photons μm−2 s−1 beginning at t = 0 for the following durations: 10, 30, 60, and 120 s. b Flash responses recorded with suction electrodes in background light. Shown are means from 5 presentations each of 7 GCAPs−/− rods to 20 ms flashes beginning at t = 0; intensity was kept at 17 photons μm−2 for flashes in backgrounds of the following intensities (in photons μm−2 s−1): 0, 4, 13, 38, and 118. Responses have been normalized cell by cell to peak amplitude of the response and averaged. The most slowly decaying response is with no background; decay time course progressively accelerated as background intensity was increased. c Weber-Fechner plot as in Fig. 2c. Graph gives mean relative sensitivity as a function of background intensity, averaged from 10 WT rods (●), 14 rods lacking the protein recoverin (■), 13 rods from which the Ca2+-calmodulin binding site of the cGMP-gated channel had been deleted (▴), and 5 GCAPs−/− rods (○). Solid line is best-fitting Weber-Fechner function for WT rods given by Eqn. (1) with I0 = 77 photons μm−2 s−1. Black dashed and dotted curves give theoretical predictions of change of sensitivity produced by simple saturation (dashed) or in the absence of cyclase and PDE feedback (dotted). See text.

