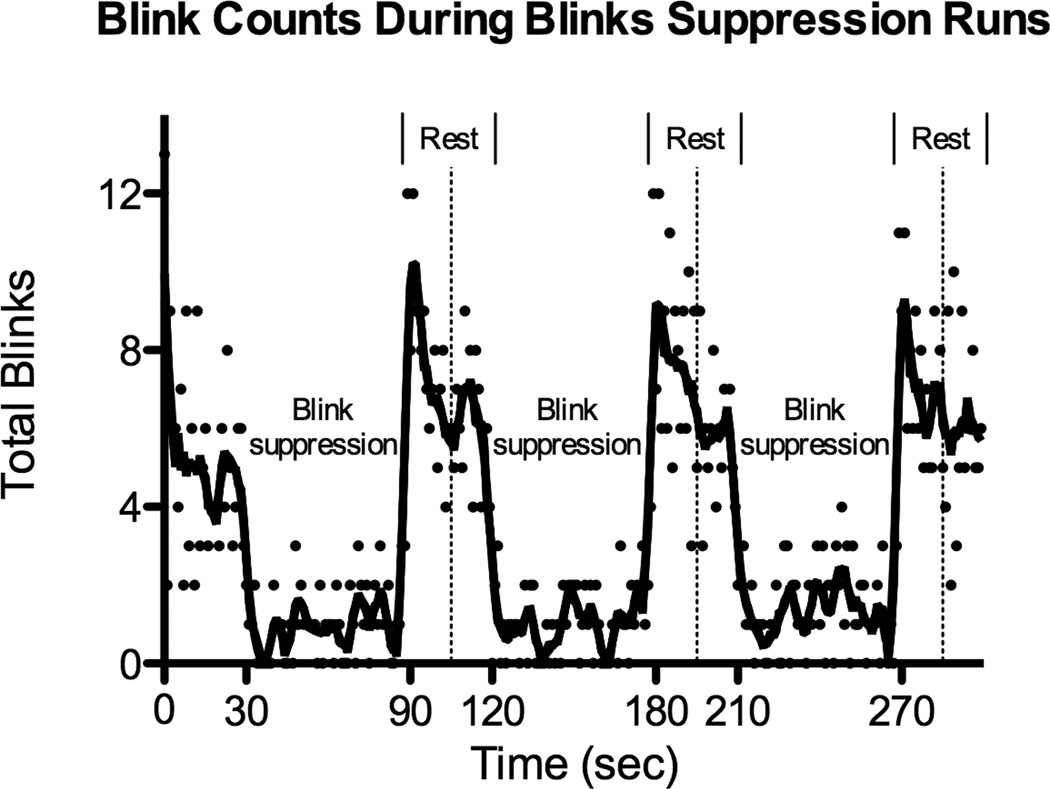
Figure 4.
Total number of detected blinks for all 18 scanning runs summed at each TR (1 sec). Each dot represents the total blink count at each time point, and the fit line was generated using a smoothing polynomial and averaging of the four nearest neighbors. Alternating 60 sec suppression blocks with 30 sec rest blocks are labeled and a dotted vertical line marks the middle of each rest block.

