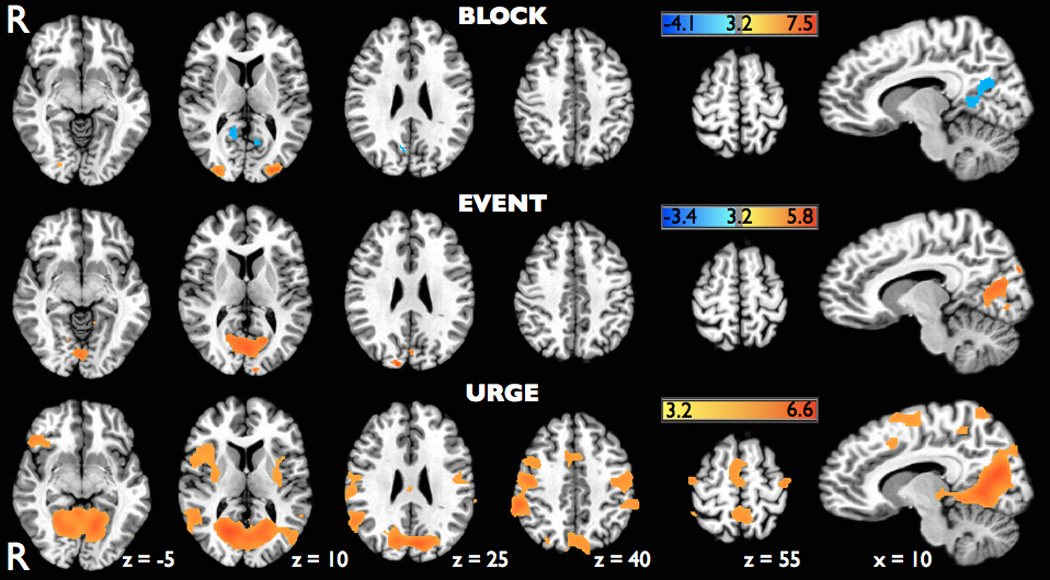
Figure 5.

Axial brain slices with superimposed statistical parametric maps on the MNI Colin N27 brain showing significant activations (red) and deactivations (blue) identified using a standard block design analysis (BLOCK), an event-related analysis of blinks (EVENT), and a hypothetical hemodynamic response function for urge (URGE) during the blink suppression scanning runs. Parametric maps were all thresholded at t = 3.2 (p<0.005, corrected).
