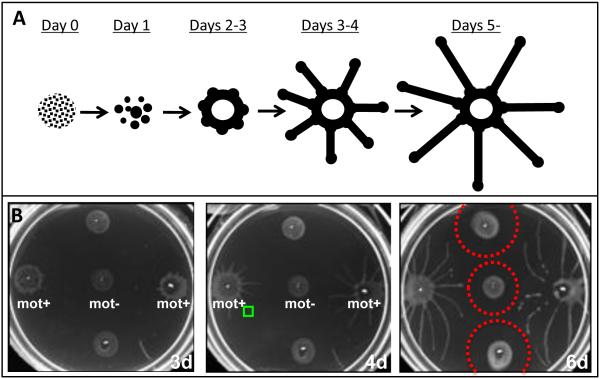
Figure 3. Social motility in T. brucei.
When cultivated on semi-solid surfaces, T. brucei engages in complex social interactions that culminate in the formation of characteristic colony patterns. (A) Schematic diagram of the main steps of social motility in T. brucei, with parasites represented in black. Initially, individual parasites (Day 0) form small groups (Day 1). These groups move en masse across the surface and grow through recruitment of additional parasites. Groups assemble at the periphery of the inoculation site, concentrating in nodes (Days 2-3). From these nodes, parasites advance outward, forming radial projections (Days 3-5) that are regularly-spaced and advance at the leading edge only (Days 5+). (B) Suspension cultures of wild type (mot +) or motility mutant (mot −) parasites were inoculated on semisolid agarose and imaged at 3, 4 or 6 days (3d, 4d, 6d) post inoculation. Social motility requires active parasite motility, as motility mutants (mot-) fail to undergo social motility. Individual cells in each projection are highly motile (see movie M2, corresponding to a region represented by the green box in panel B4d). Projections can sense neighboring cells and halt or redirect their movements to avoid contact, resulting a zone of avoidance (dotted red circles in panel B6d). Adapted from [38] with permission.

