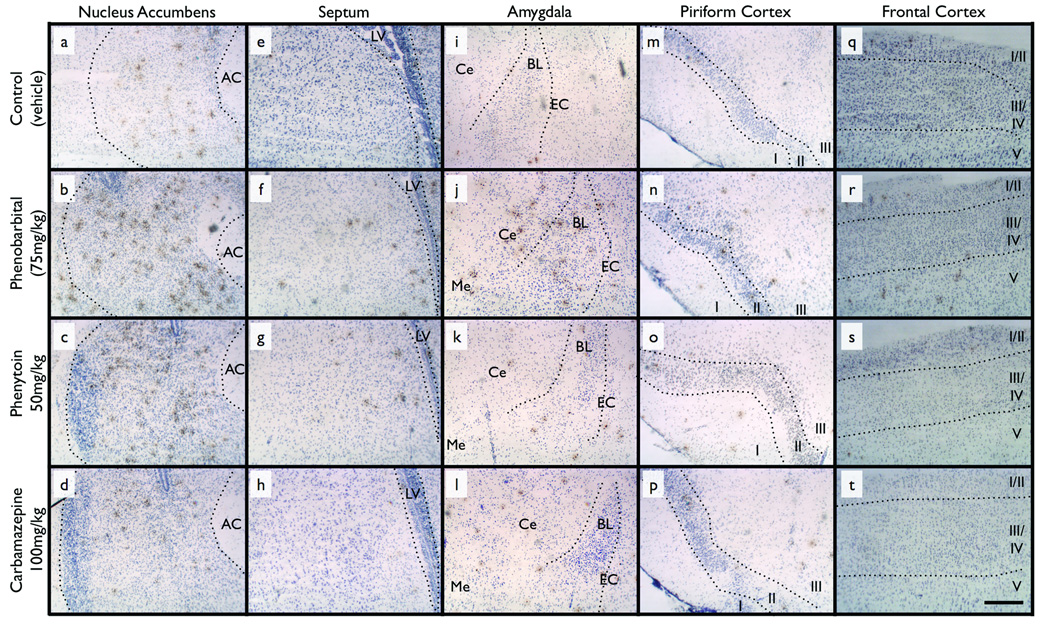
Figure 1.
Representative photomicrographs of TUNEL-stained sections for each brain region from animals treated with: vehicle (control) (a, e, i, m, q), phenobarbital (b, f, j, n, r), phenytoin (c, g, k, o, s), and carbamazepine (d, h, l, p, t). Dotted lines illustrate anatomical boundaries. TUNEL positive cells are stained brown. Scale bar = 250µm. AC = anterior commissure, LV = lateral ventricle, Ce = Central amygdala, BL = basal and lateral amygdala, EC = external capsule, Roman numerals I to IV = cortical layers one to five. See Figure 2 for schematic representations of brain regions.

