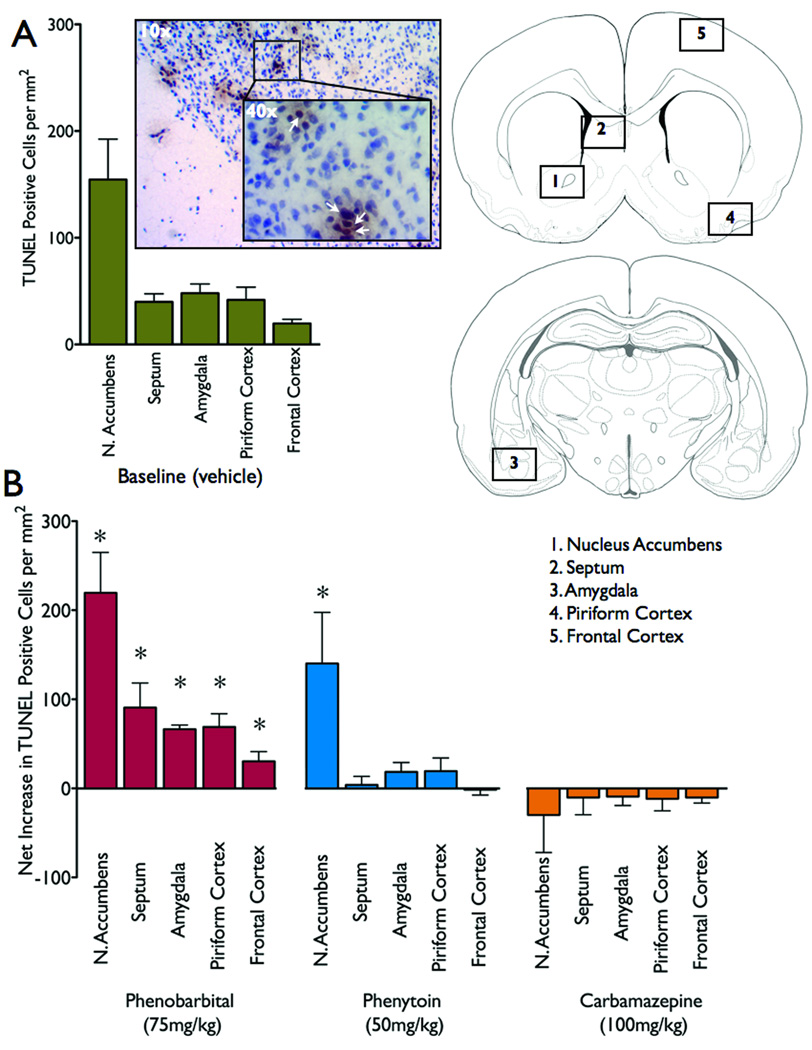
Figure 2.
Quantification of cell death. (a) Baseline levels of cell death following vehicle (control). (b) Net increase (over baseline cell death, as presented in Figure 2a) for each brain area and drug treatment. * = significantly different than baseline levels of cell death, P<0.05. Schematics are modified from the atlas of Sherwood and Timiras (1970). Photomicrograph (10x) of nucleus accumbens with the inset showing TUNEL-positive cells (40x, indicated by white arrowhead).

