Fig. 1.
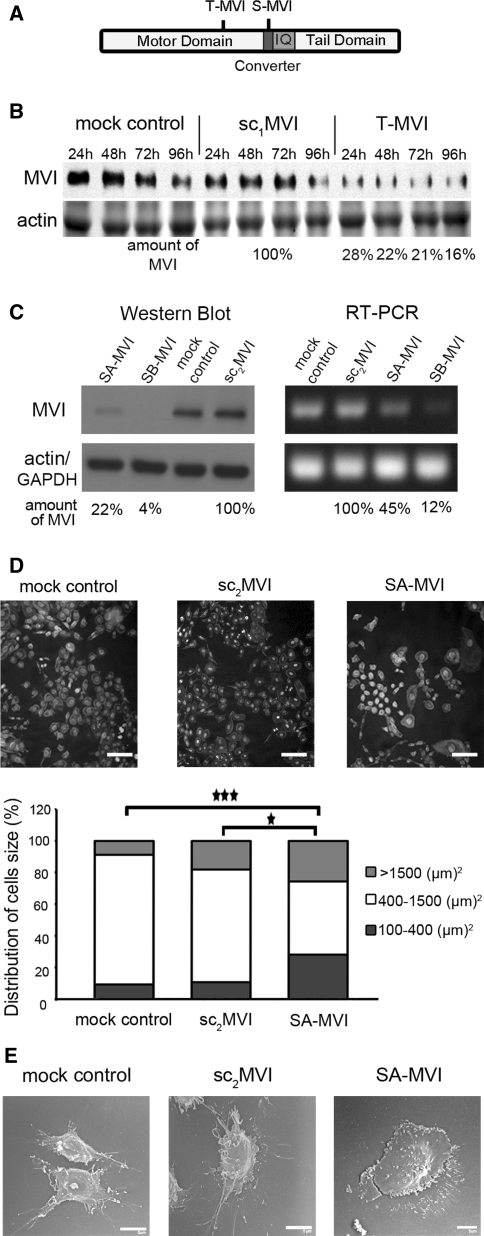
Depletion of MVI by siRNA technique affects morphology of PC12 cells. a Diagram presenting the location of the regions to which shRNA oligos were produced to obtain cell lines with transient MVI knockdown (T-MVI cells) and stable MVI knockdown (S-MVI cells); b Immunoblot analysis of MVI level in lysates of cells transiently transfected with pSilencer vector to knockdown MVI gene expression (T-MVI) as well as lysates of control cells without the vector (mock control) and the vector containing scrambled shRNA sequence (sc1MVI), 24, 48, 72 and 96 h after transfection. Lower panel, a 42-kDa band corresponding to actin was stained with Ponceau red on a nitrocellulose membrane after transfer of the gel with the above described samples. The quantification of MVI content in T-MVI samples in every time-point was made in reference to control sc1MVI lysates at the corresponding time-point. c Immunoblot and RT-PCR analyses of SA-MVI and SB-MVI cells as well as of mock-control cells and sc2MVI cells. Lower panels, a 42-kDa band detected with anti-β-actin antibody and an amplified GAPDH fragment, used as internal controls. The quantification of MVI content in SA-MVI and SB-MVI samples was made in reference to the control sc2MVI sample. For b and c, this is as representation of results obtained from three independent experiments. d Analysis of size of SA-MVI, mock control and sc2MVI cells. Cells were stained with TRITC-phalloidin and DAPI, and then cell area was estimated with Leica software; bar 50 μm. The results are presented for 150 cells from each cell type, where 100% represents the sum of the cells of a given line subjected to the analysis. Statistical relevance measured with Student’s t test *P < 0.05 and ***P < 0.001, respectively. e Scanning electron microscopy images of examples of SA-MVI as well as mock control and sc2MVI cells. Bars 5 μm. All other details as described under “Materials and methods” section

