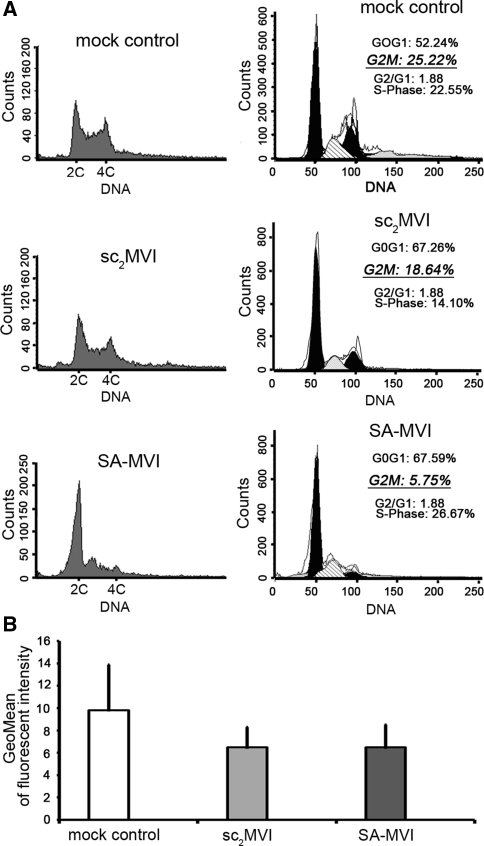
Fig. 4.
MVI and the PC12 cell cycle. a Flow cytometric analysis of cell cycle of SA-MVI, mock transfected and sc2MVI cells. DNA content was estimated using propidium iodide (left panels) and cell cycle analysis (right panels) was made with Modtif software (Becton–Dickinson). These are representative histograms and analyses from three independent experiments. b SA β-galactosidase activity measurements of SA-MVI and mock transfected and sc2MVI cells. The bars represent the mean values (±SD) of fluorescence corresponding to SA β-galactosidase product. The values were obtained from three independent experiments. Other details as described under “Materials and methods” section

