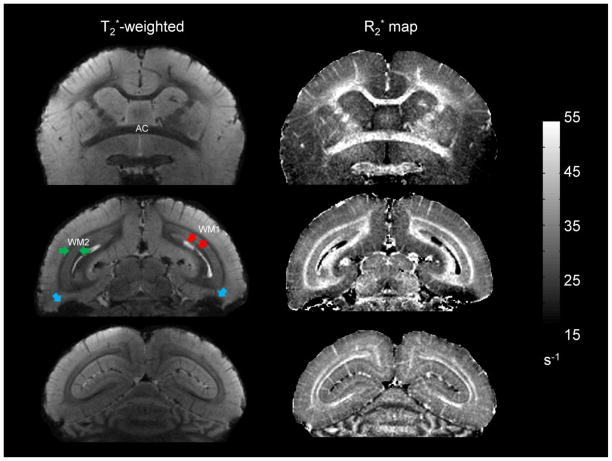
Figure 3.
Different coronal slices from the same monkey acquired in sphinx position. The left column shows the magnitude image averaged over the three longest echoes (TE = 24.5, 31.5, and 38.5 ms). The right column shows the corresponding R2* maps. Images are displayed from anterior (top) to posterior (bottom). The grayscale bar for R2* relaxation rate is given in s−1. The optic radiations, labeled as WM2 (green arrows), are adjacent to perpendicularly oriented fibers, labeled as WM1 (red arrows). Note the difference in T2* contrast and R2* values between these two adjacent fiber bundles. Note also the non-tissue-specific intensity variations observed in the inferior temporal lobes (blue arrows).

