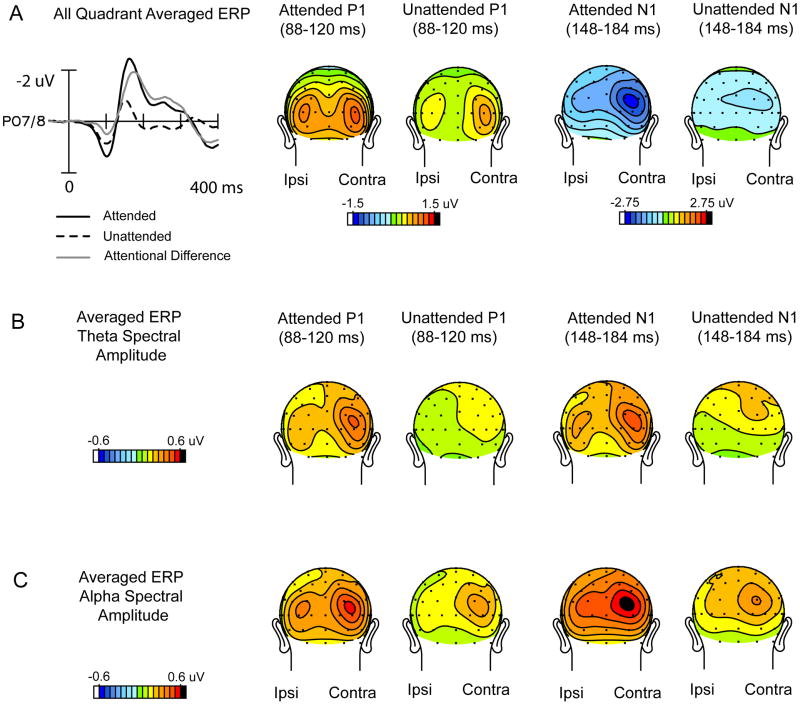
Figure 3.
Grand-averaged ERPs averaged over all quadrants. (A) Time domain waveforms and scalp voltage topographies in the P1 and N1 latency ranges collapsed over left and right quadrants such that contralateral scalp sites are on the right of each head map and ipsilateral sites are on the left. (B) Corresponding topographies of theta spectral amplitudes resulting from wavelet analysis of these ERPs averaged over all quadrants. (C). Same as B for the alpha spectral amplitudes.

