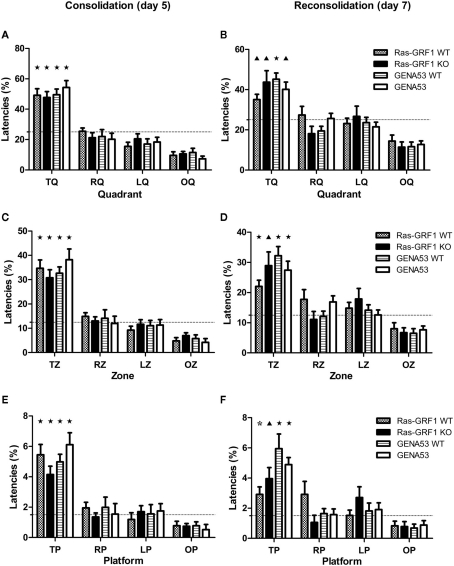
Figure 2.
Spatial memory in the Morris water maze. Percentages (mean ± SEM) of time spent in target quadrant (first row: A,B), target zone (second row: C,D), and target platform (third row: E,F). Spatial memory consolidation (day 5 probe trial) is shown in the left column (A,C,E), while spatial memory reconsolidation (day 7 probe trial) is shown in the right column (B,D,F). Ras-GRF1 WT (n = 12); Ras-GRF1 KO (n = 12); GENA53 WT (n = 12); GENA53 (n = 12). Percentages in target area are compared against chance level. Dashed lines represent chance level for each area (quadrant: 25%; zone: 12.5%; platform: 1.5%). T, target; R, right; L, left; O, opposite. P-value symbols: black star = p < 0.001; black triangle = p < 0.01; asterisk = p < 0.05.

