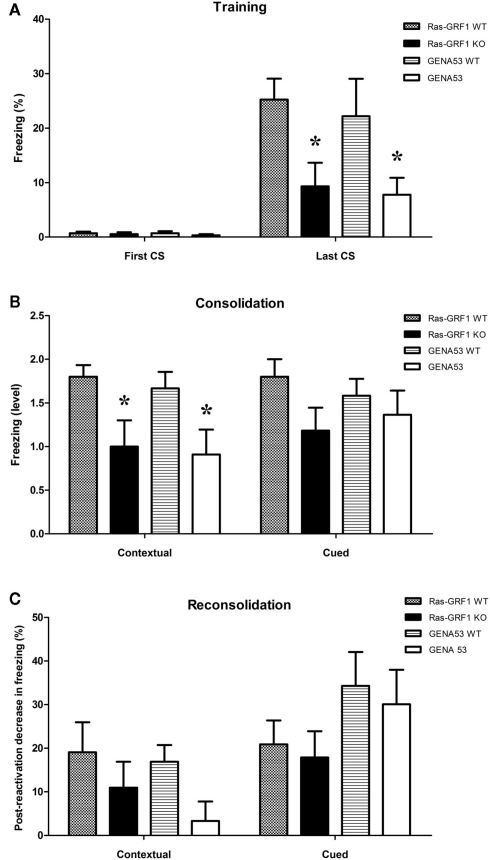
Figure 4.
Contextual and cued fear conditioning. Fear memory (means ± SEM) in the training (A), test (B), and re-test (C) phases. (A) Percentage of freezing at the beginning (first CS) and at the end (last CS) of the training. (B) Freezing level in the memory consolidation test (categorized by performance: 0 = non-learner; 1 = bad learner; 2 = good learner). (C) Decrease of freezing percentage in the memory reconsolidation test (percentage of freezing before reactivation minus percentage of freezing post-reactivation). Ras-GRF1 WT (n = 10); Ras-GRF1 KO (n = 11); GENA53 WT (n = 12); GENA53 (n = 11). Each mutant is compared with its respective wild-type by means of a post hoc comparison. P-value symbols: black star = p < 0.001; black triangle = p < 0.01; asterisk = p < 0.05.

