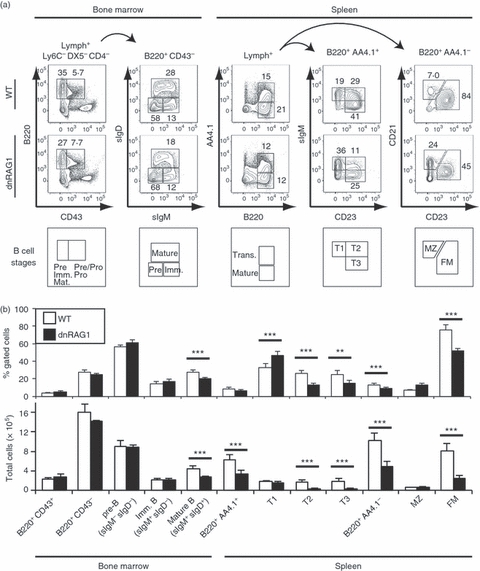
Figure 2.

The dnRAG1 mice show evidence of impaired B-cell development at the immature-to-mature transition. (a) Cells prepared from wild-type (WT) or dnRAG1 bone marrow or spleen and identified by the gating parameters shown above each column were analysed for the expression of B220, CD43, sIgM, sIgD, CD21, and CD23. B-cell developmental subsets specified by the staining pattern are indicated below each column with corresponding gates. The percentage of cells within the identified gates is shown for representative animals. (b) Statistical analysis of data obtained from n = 3 to n = 7 WT and dnRAG1 mice for the various B-cell populations identified in (a). The percentage and absolute number of cells of each population is presented in bar graph format; significance determined from post-hoc analysis following one-way anova (*P<0·05; **P<0·01; ***P <0·005) (see Table S2).
