
Figure 1.
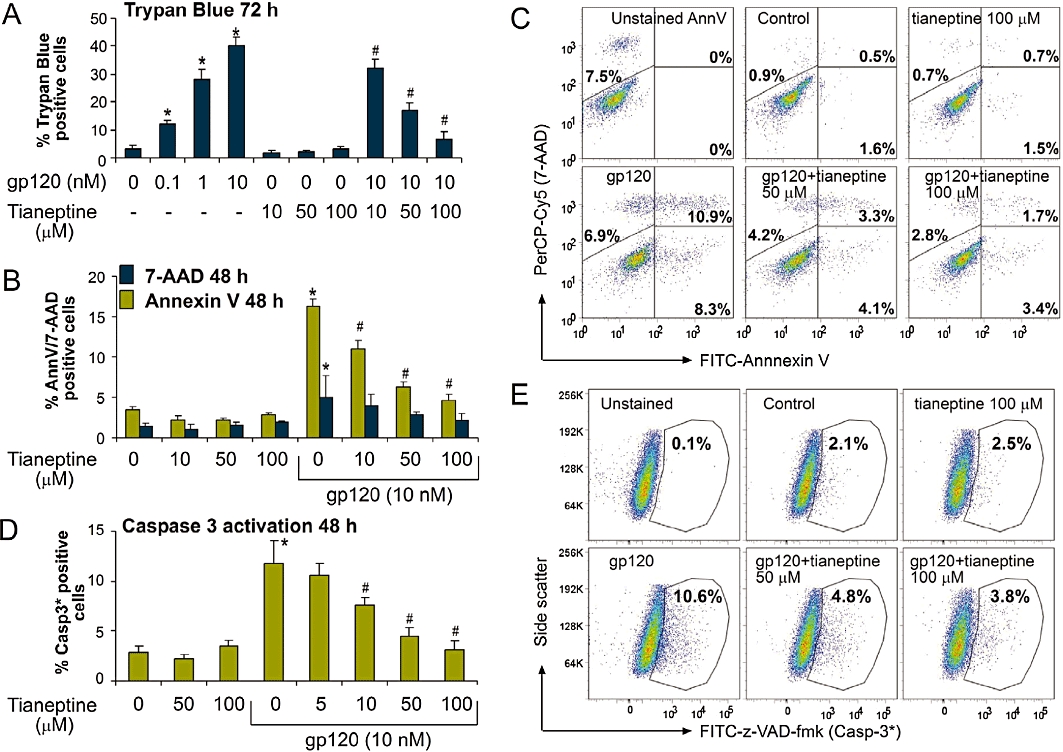
Tianeptine prevents gp120-induced apoptotic cell death in cultured astroglial cells. (A) Lipari astroglial cells were treated with gp120 for 72 h. Tianeptine was added 1 h before the addition of gp120. Cell mortality was assessed by % trypan blue positive cell counts after enzymatic cell detachment by trypsin. Data represent the mean of eight independent experiments ± SEM. The * indicates a statistically significant difference at P < 0.05 for gp120-treated astrocytes versus control; # indicates a statistically significant change at P < 0.05 for gp120 plus tianeptine versus gp120 only-treated astrocytes. (B) Incubation of Lipari astroglial cells with gp120 (10 nM) for 48 h induced mainly apoptotic cell death, as assessed by FITC-Annexin V/7-AAD double labelling followed by FACS bi-parametric analysis. Tianeptine (10, 50, 100 µM) prevented the effect of gp120. Cells (0.8 × 104 cm−2) were seeded 24 h before the treatment. Annexin V columns show the percentage of total Annexin V positive cells, early (Annexin V positive 7-AAD negative) and -late (double stained) apoptotic cells; 7-AAD only columns show the percentage of Annexin V negative, 7-AAD positive cells which correspond mainly to necrotic cells. Data represent the mean ± SEM of three independent experiments. *, # − see (A). (C) Representative dot plots of FITC fluorescence versus 7-AAD fluorescence for the experiment shown in (B). Unstained AnnV – cells stained with 7-AAD, but not with FITC-Annexin V. (D) Incubation of U373 astroglial cells with gp120 for 48 h leads to caspase-3 activation as shown by the increased binding to FITC-conjugated z-VAD-fmk. Tianeptine antagonized the caspase-3 cleavage in response to gp120. U373 astroglial cells were treated and untreated with tianeptine at different concentrations and then stimulated or not with gp120 (10 nM). 48 h later the cells were incubated with FITC-z-VAD-fmk and processed for FACS analysis, followed by FlowJo analysis of FITC-positive gate. The experiment was performed four times in triplicate. *, # − statistical analysis was performed as in (A). (E) Representative dot plots of FITC fluorescence versus side-scatter for the experiment shown in (D).