
Figure 4.
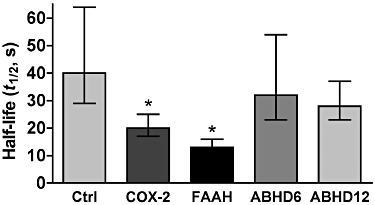
Summary of changes to DSE t1/2 after overexpression of four endocannabinoid-metabolizing enzymes. Bar graph shows t1/2-values of DSE (s) for untransfected neurons (control) versus neurons transfected with COX-2, FAAH, ABHD6 or ABHD12. Error bars represent 95% CIs with a Bonferroni correction for multiple comparisons (see Methods).