
Figure 5.
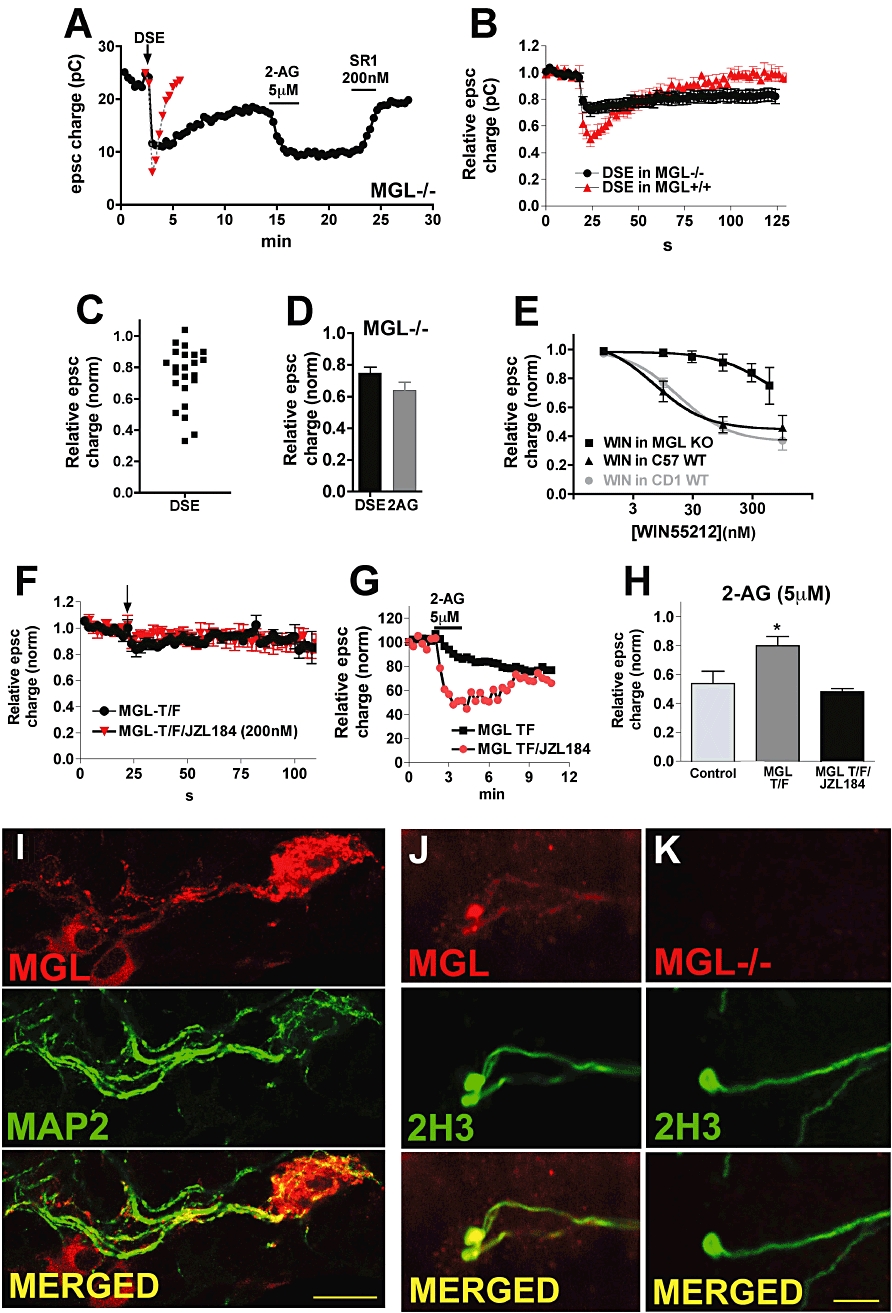
Robust DSE requires an optimal level of MGL. (A) Sample time course shows epscs in MGL−/− neuron after DSE stimulation (arrow), 2-AG treatment (5 µM) and reversal by CB1 antagonist SR141716 (200 nM). Example of WT DSE time course is included for comparison. (B) Averaged DSE time courses from MGL−/− and MGL+/+ cultures. (C) Scatter plot of inhibition values after the DSE stimulus in MGL−/− neurons shows that DSE is diminished in most neurons. (D) Bar graph shows epsc inhibition in response to DSE or 2-AG (5 µM) in MGL−/− neurons. (E) WIN55212-2 responses are desensitized in MGL KO neurons. Concentration–response curves for WIN55212-2 in MGL KO and wild-type (C57) neurons. The CD1 wild-type WIN55212-2 concentration–response is shown for comparison (adapted from Straiker and Mackie, 2005). (F) Averaged DSE time course for wild-type neurons transfected with MGL under control conditions or after treatment overnight with MGL blocker JZL184 (200 nM). Arrow indicates the point at which the cell was depolarized for 3 s. (G) Sample time courses in response to 2-AG (5 µM) in MGL-transfected neuron (the incomplete recovery is probably due to 2-AG-induced LTD; Kellogg et al., 2009) and in MGL-transfected neurons treated overnight with JZL 184 (200 nM). (H) Bar graph shows average 5 µM 2-AG responses for untransfected neurons, MGL-transfected neurons and MGL-transfected neurons treated overnight with JZL184 (200nM). (I) Micrograph shows MGL-transfected neuron stained for HA11 and MAP2, a dendritic marker. Bottom panel shows overlay of the two channels (yellow represents overlap, scale bar = 25 µm). (J) Micrographs show MGL antibody (top panel) staining for the axonal marker, 2H3 (centre panel) and overlap (bottom panel, overlap in yellow) in a WT untransfected neuron. (K) Same layout as (J), but in MGL−/− neuronal cultures. Panels (J–K) show that the MGL antibody stains axons. Scale bar = 20 µm.