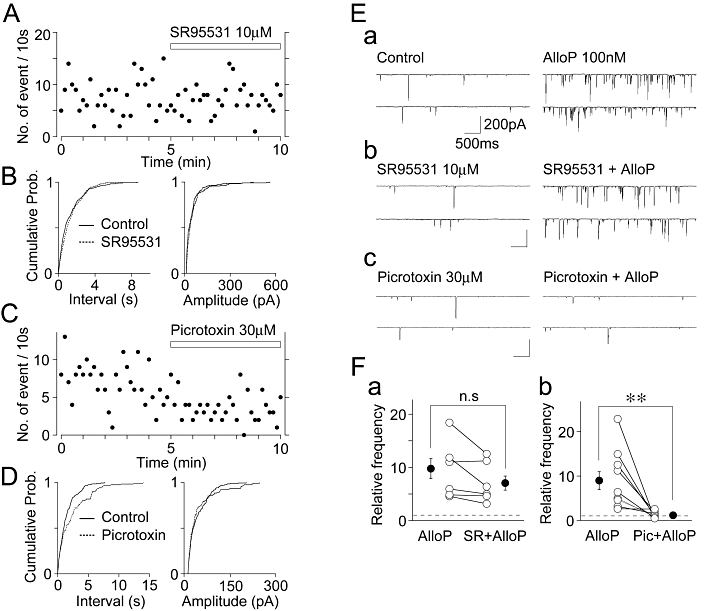
Figure 2.

Effects of GABAA receptor antagonists on the basal frequency of sEPSCs and the AlloP-induced increase in sEPSC frequency. (A) A typical time course of sEPSC frequency before and during the application of 10 µM SR95531. The number of events in every 10 s period was summed and plotted. (B) Cumulative probability distributions for the inter-event interval (left) and amplitude (right) of basal glutamatergic sEPSCs shown in (A). 232 for the control and 223 events for SR95531 were plotted. (C) A typical time course of sEPSC frequency before and during the application of 30 µM picrotoxin. The number of events in every 10 s period was summed and plotted. (D) Cumulative probability distributions for the inter-event interval (left) and amplitude (right) of basal glutamatergic sEPSCs shown in (C). 208 for the control and 122 events for picrotoxin were plotted. (E) Typical traces of sEPSCs recorded before (left) and during (right) the application of 100 nM AlloP in the control external solution (a), in the presence of 10 µM SR95531 (b), and in the presence of 30 µM picrotoxin (c). (F) Changes of the AlloP-induced facilitation of sEPSC frequency in the absence and presence of 10 µM SR95531 (a, n = 7) and 30 µM picrotoxin (b, n = 10). Open circles and connected lines represent the individual results, whereas closed circles and error bars indicate the mean ± SEM.
