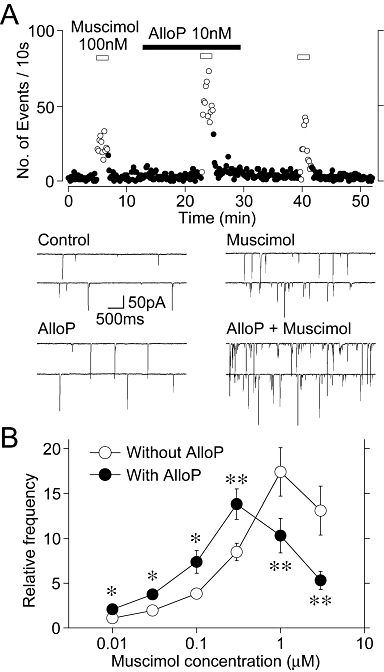
Figure 3.

Effect of AlloP on the muscimol-induced increase in sEPSC frequency. (A) A typical time course of sEPSC frequency before, during and after the application of 100 nM muscimol in the absence and presence of 10 nM AlloP. The number of events in every 10 s period was summed and plotted. Inset traces represent typical sEPSPs in numbered regions with an expanded time scale. (B) Changes of the muscimol-induced increase in sEPSC frequency in the absence and presence of 10 nM AlloP. Each point and error bar represents the mean ± SEM from 5–8 experiments. *P < 0.05, **P < 0.01. Note that AlloP shifted the concentration–response relationship of muscimol to the left.
