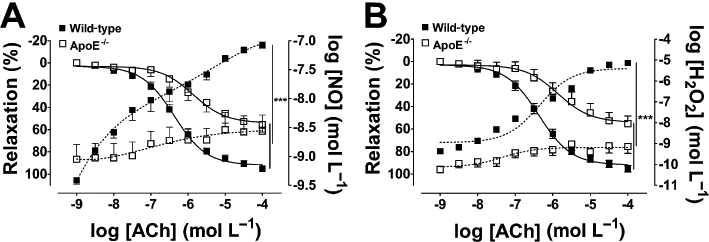
Figure 1.

Simultaneous measurements of vasodilatation (A,B), and NO (A) and H2O2 (B) production stimulated by ACh in the aortas of wild-type and ApoE−/− mice. Continuous lines represent vasodilatation (left axis); dotted lines: NO (A) and H2O2 (B) measurements (right axis). The data are shown as mean ± SEM of at least five experiments. ***P < 0.001.
